
I study how people engage and make decisions with data
I design new interfaces and visualizations to interact
with data
I assist impactful domains drowning in data.
Much of my work also deals with the ubiquity of
AI, where I help interpret data masked by complex AI techniques and facilitate human-AI collaboration.
I co-direct the Data Interaction Group, whose mission is to empower everyone to analyze and communicate data with interactive systems.
Adam Perer is an Assistant Professor at Carnegie Mellon University, where he is a member of the Human-Computer Interaction Institute and he is Co-Director of the Data Interaction Group. His research integrates data visualization and machine learning techniques to create visual interactive systems to help users make sense out of big data. Lately, his research focuses on human-centered data science and extracting insights from clinical data to support data-driven medicine. He has published over 50 peer-reviewed papers at premier venues in visualization, human-computer interaction, and medical informatics. He is currently an Area Papers Chair at IEEE VIS and a Visualization Subcommittee Papers Chair at ACM CHI. He was previously a Research Scientist at IBM Research. He holds a Ph.D. in Computer Science from the University of Maryland, College Park.
Selected Publications (View all publications)
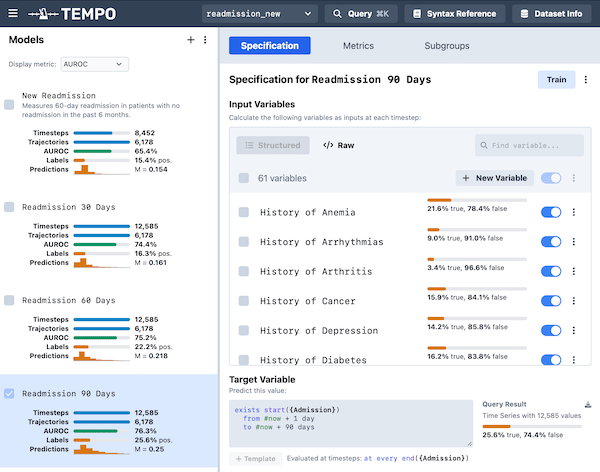
Tempo: Helping Data Scientists and Domain Experts Collaboratively Specify Predictive Modeling Tasks
CHI 2025
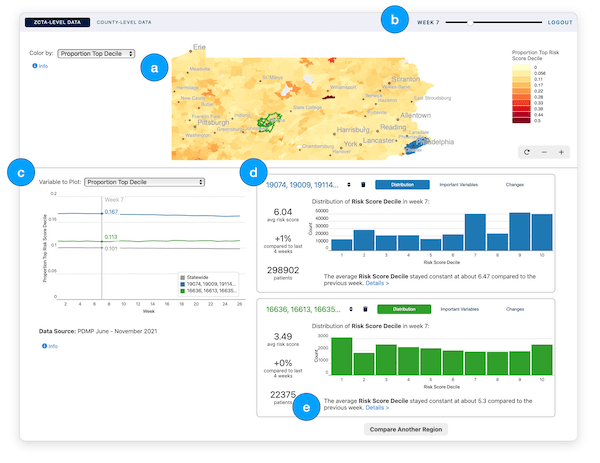
Static Algorithm, Evolving Epidemic: Understanding the Potential of Human-AI Risk Assessment to Support Regional Overdose Prevention
CSCW 2025
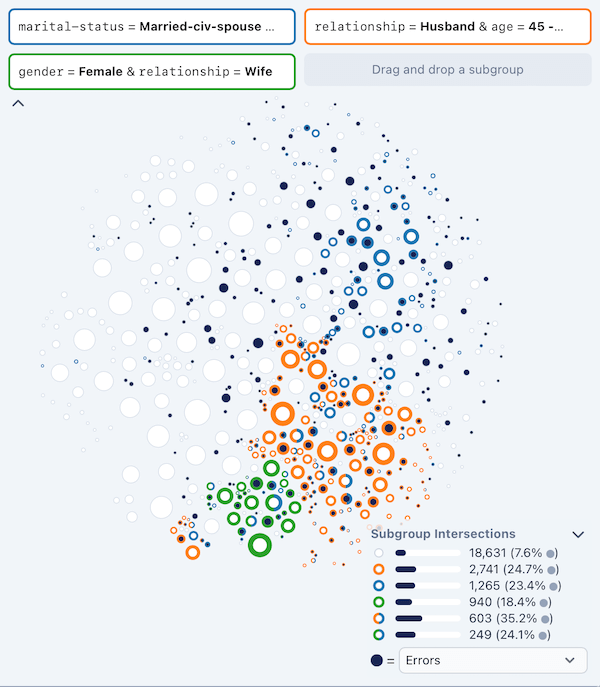
Divisi: Interactive Search and Visualization for Scalable Exploratory Subgroup Analysis
CHI 2025
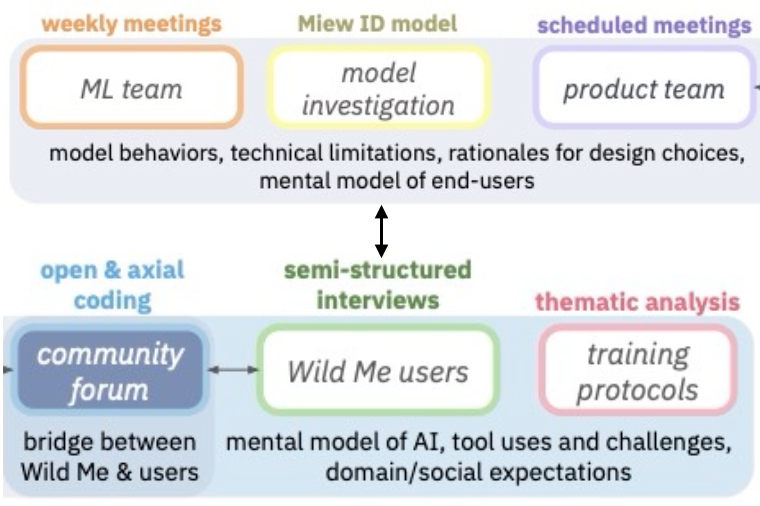
Transparency in the Wild: Navigating Transparency in a Deployed AI System to Broaden Need-Finding Approaches
FAccT 2024
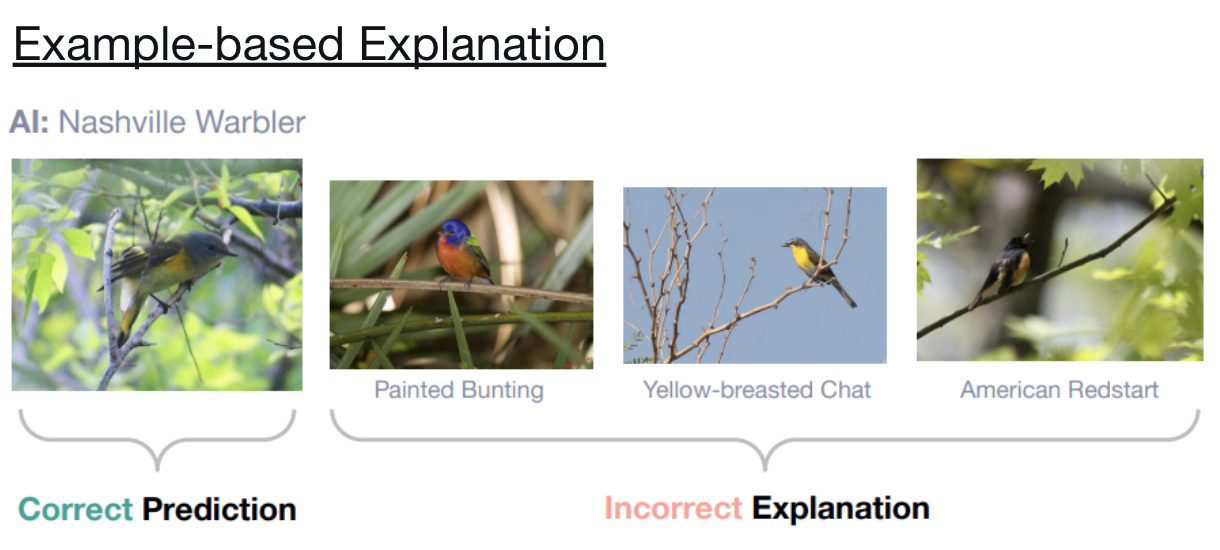
The Impact of Imperfect XAI on Human-AI Decision-Making
CSCW 2024
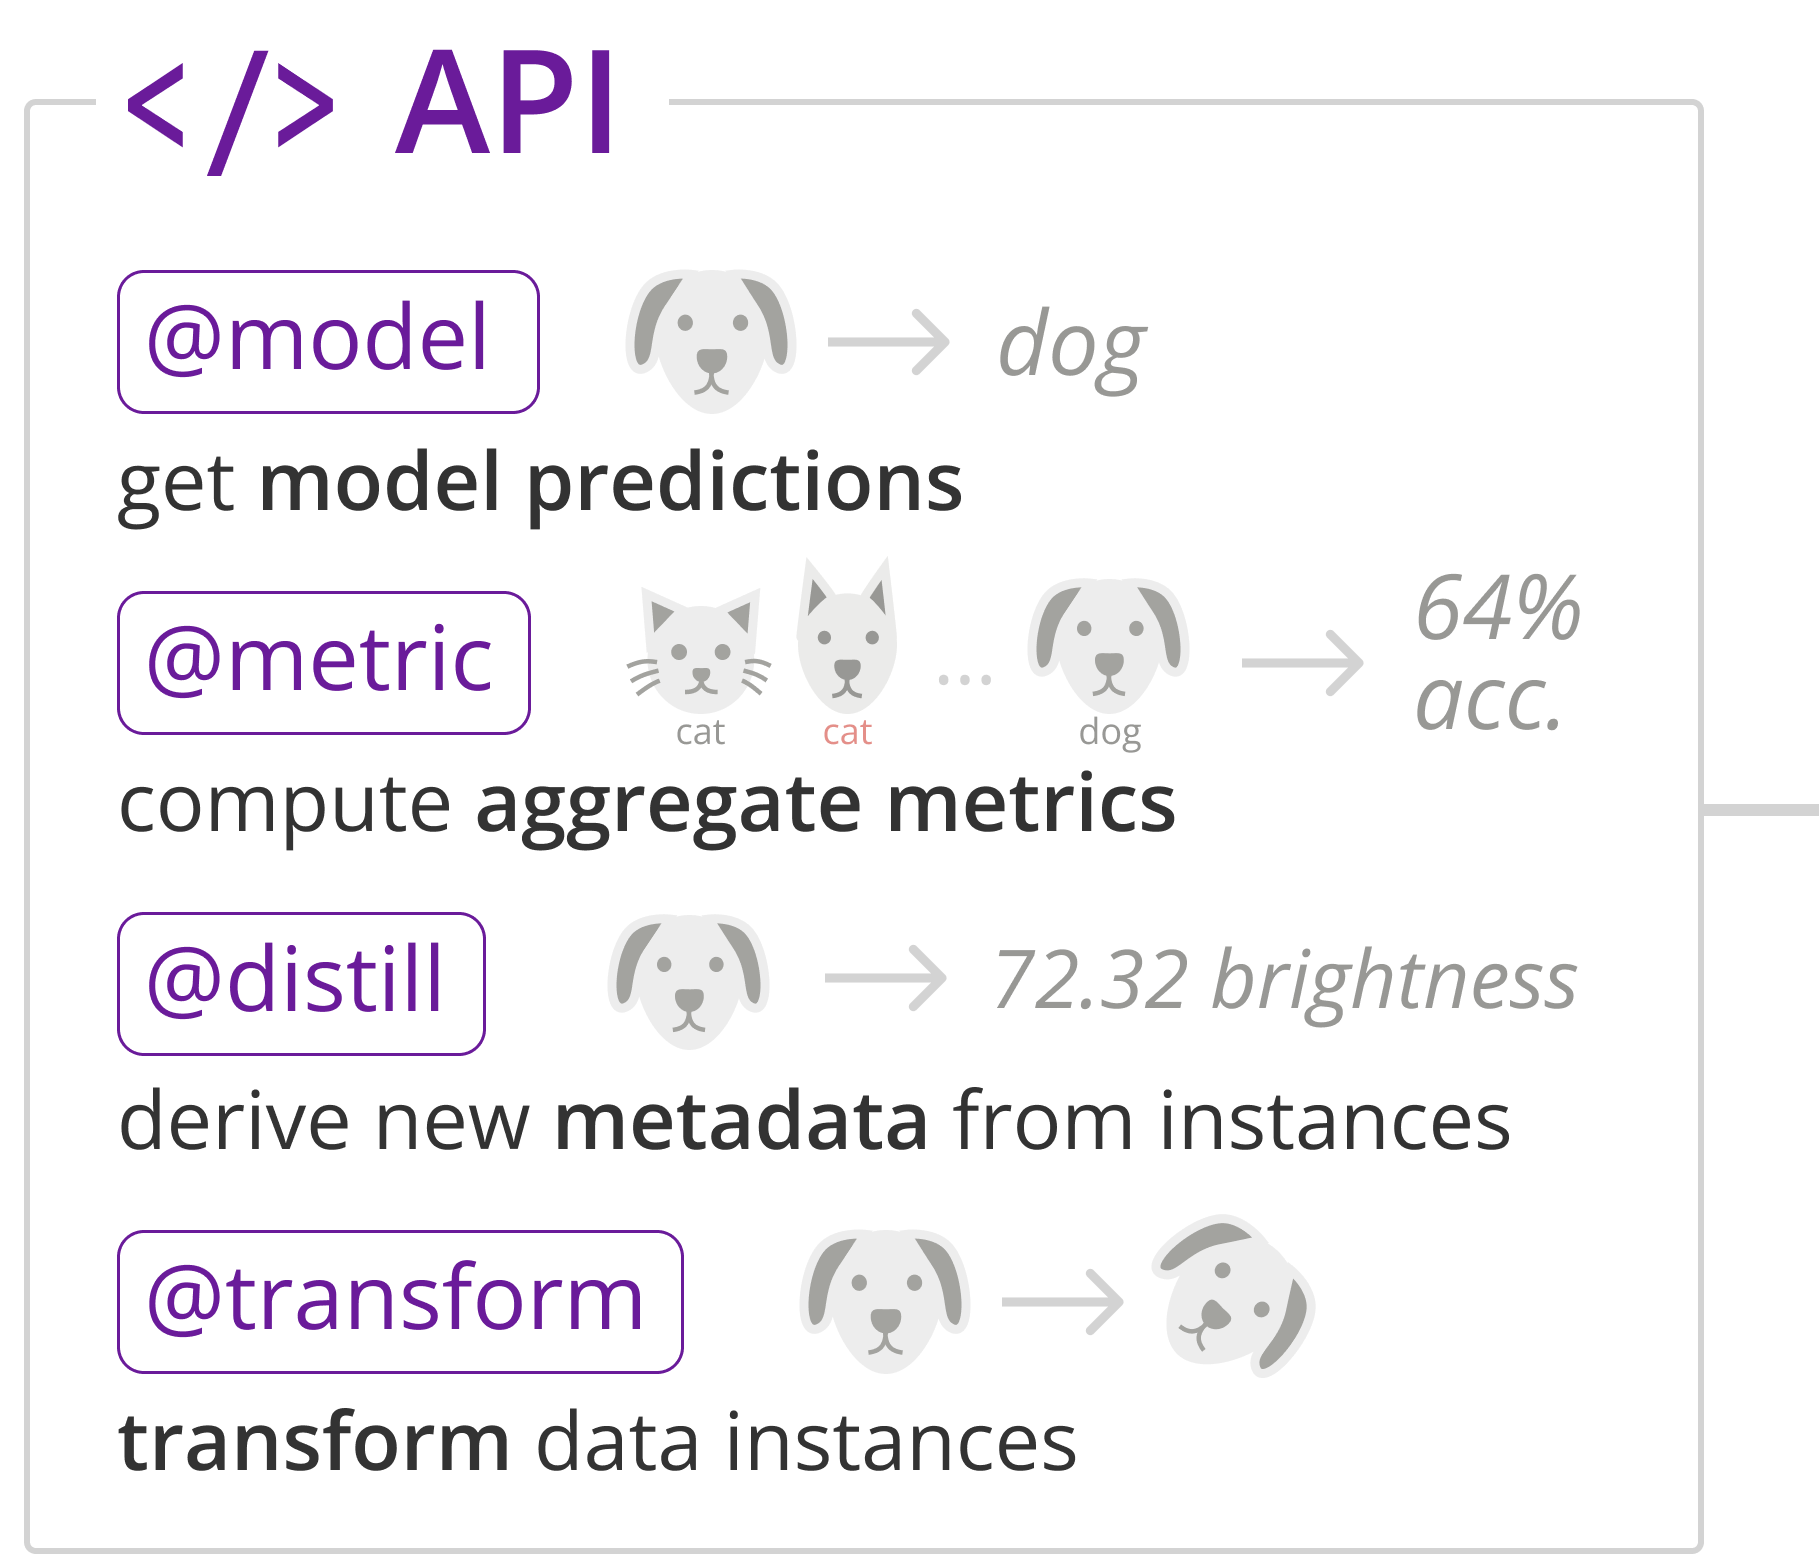
Zeno: An Interactive Framework for Behavioral Evaluation of Machine Learning
CHI 2023
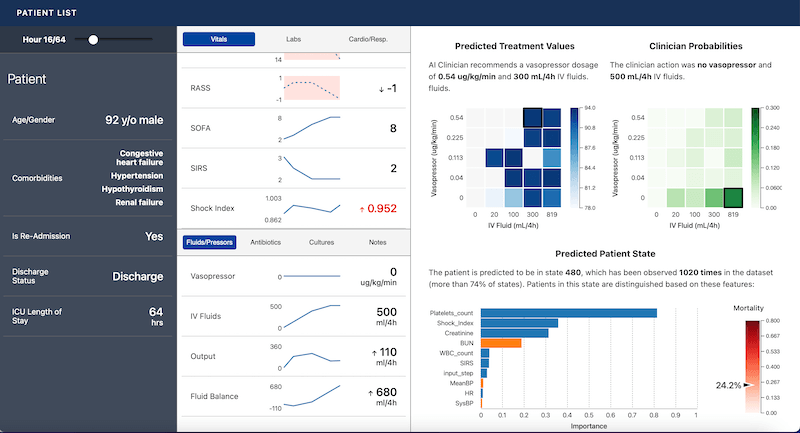
Ignore, Trust, or Negotiate: Understanding Clinician Acceptance of AI-Based Treatment Recommendations in Health Care
CHI 2023
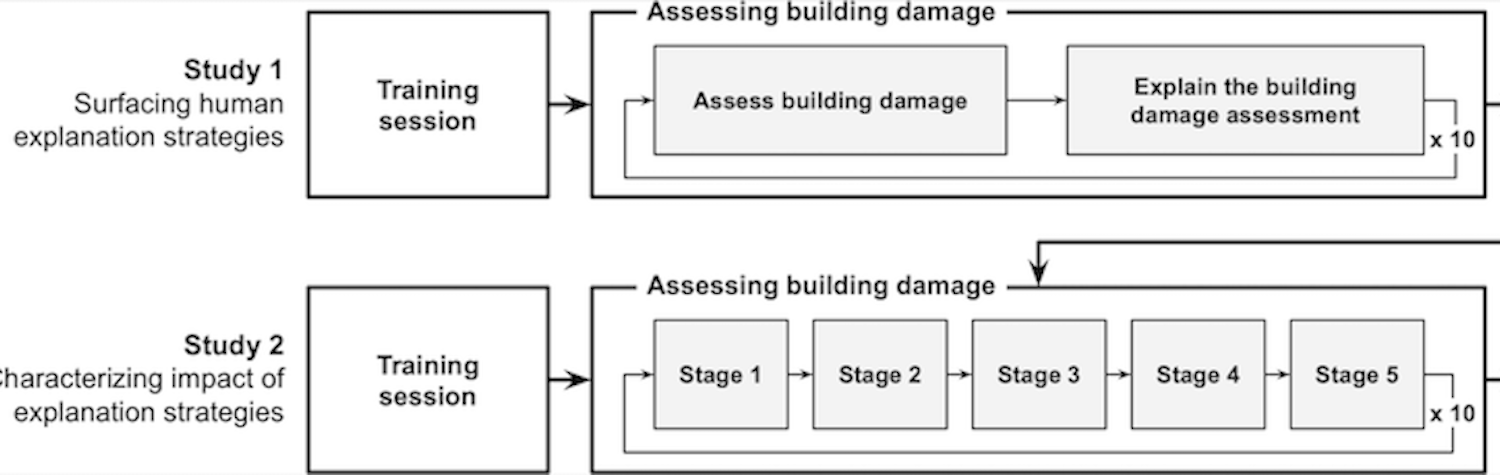
Evaluating the Impact of Human Explanation Strategies on Human-AI Visual Decision-Making
CSCW 2023
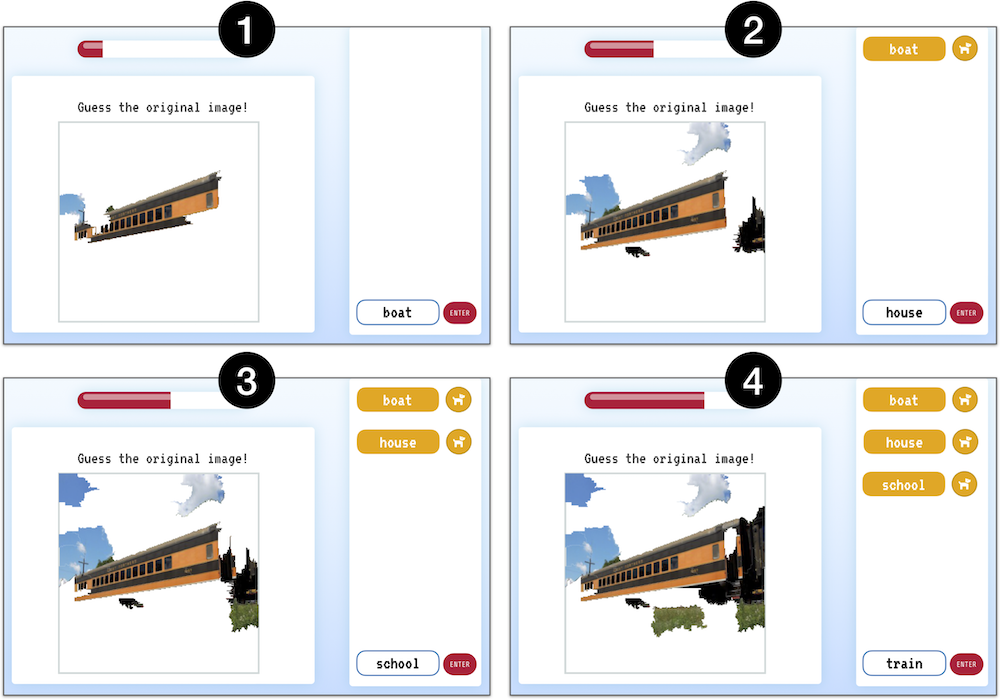
Eye into AI: Evaluating the Interpretability of Explainable AI Techniques through a Game With a Purpose
CSCW 2023
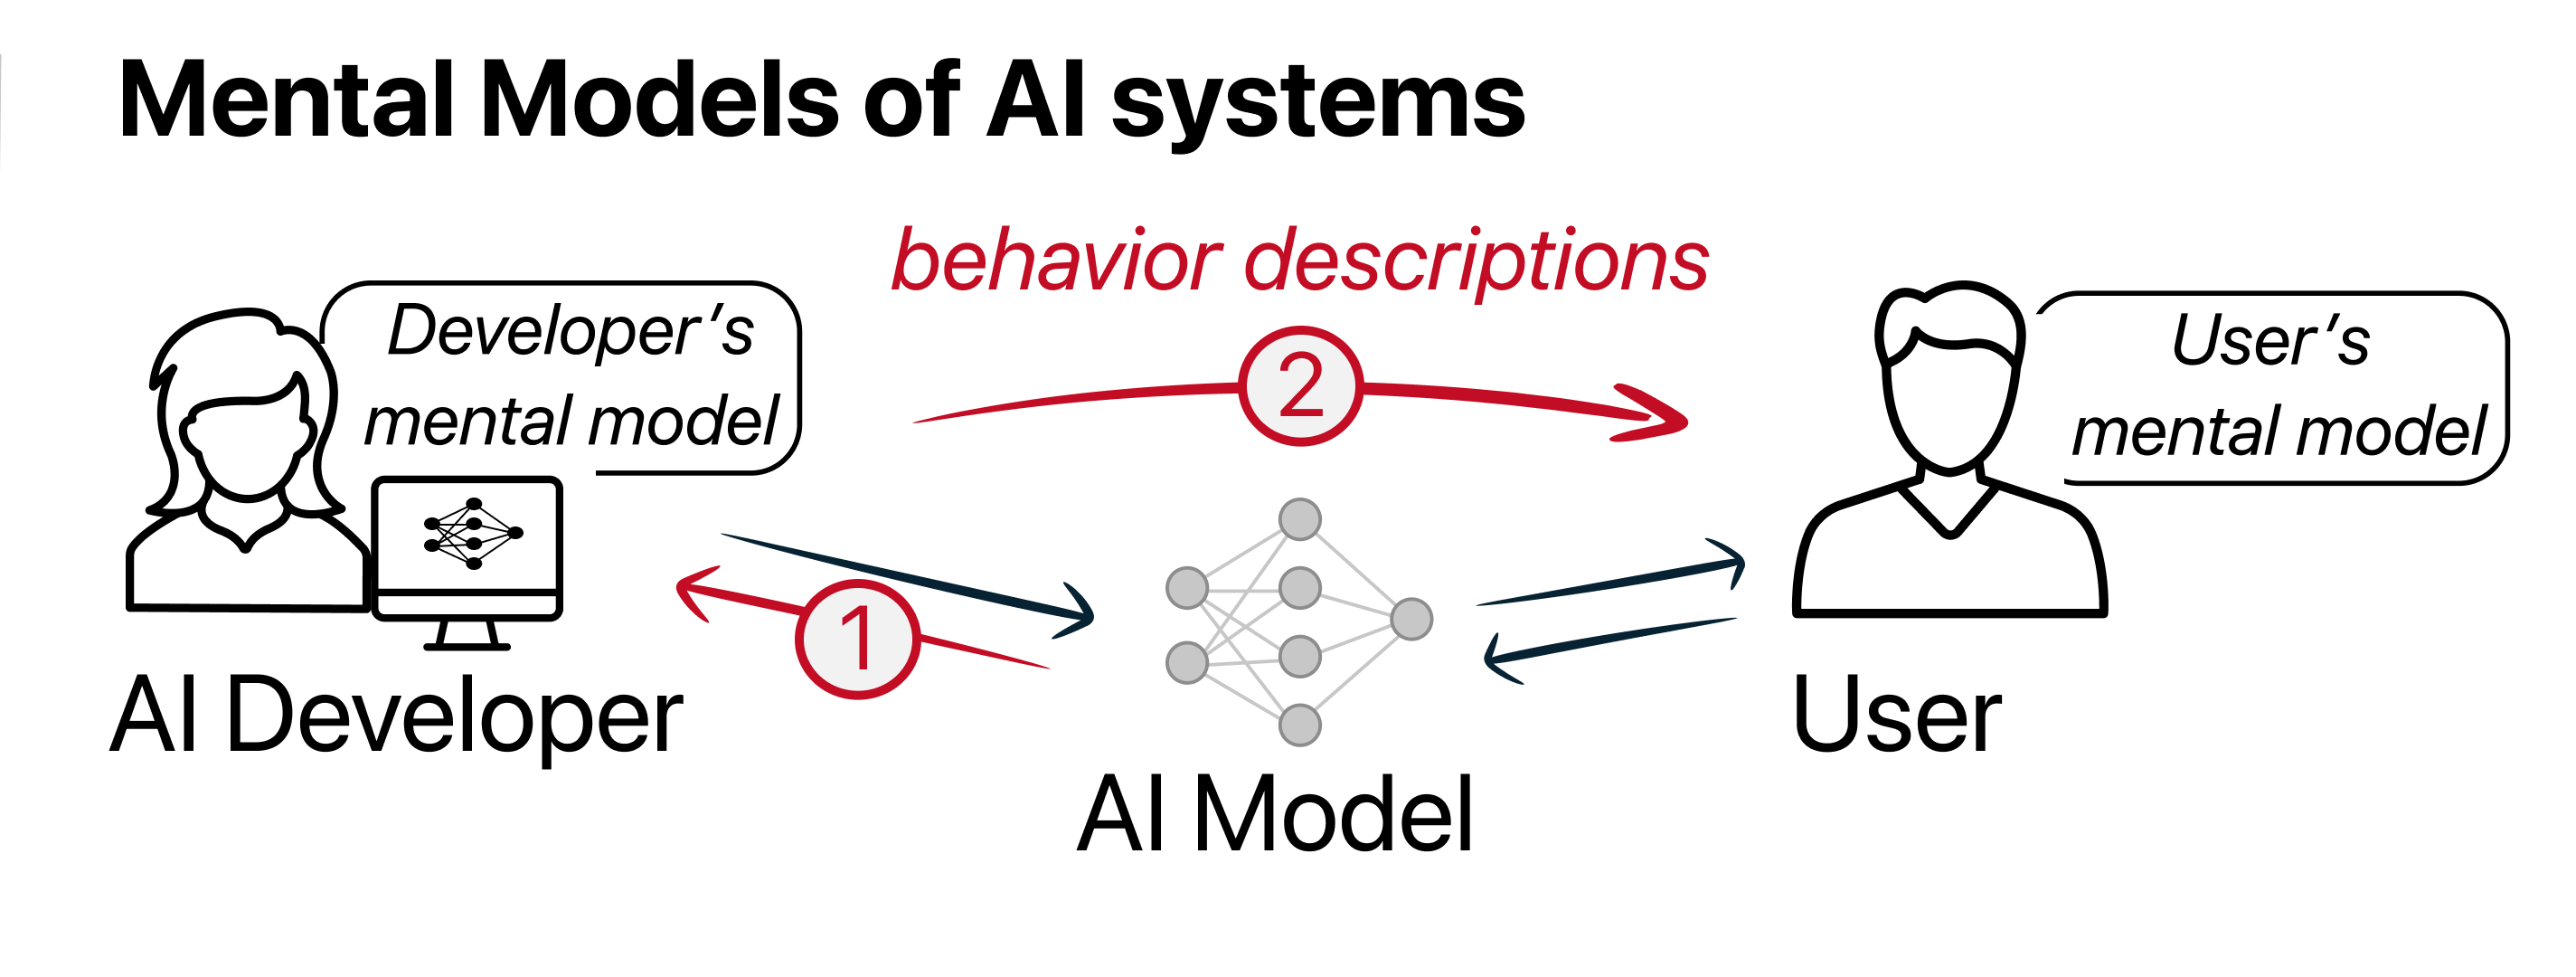
Improving Human-AI Collaboration with Descriptions of AI Behavior
CSCW 2023
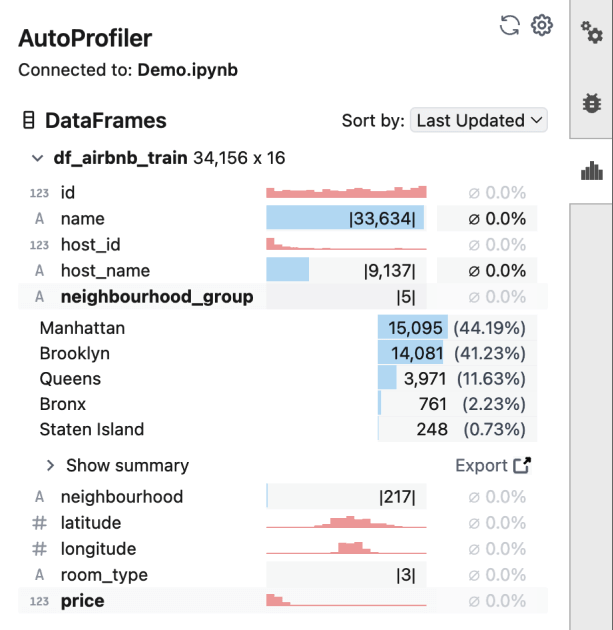
Dead or Alive: Continuous Data Profiling for Interactive Data Science
VIS 2023
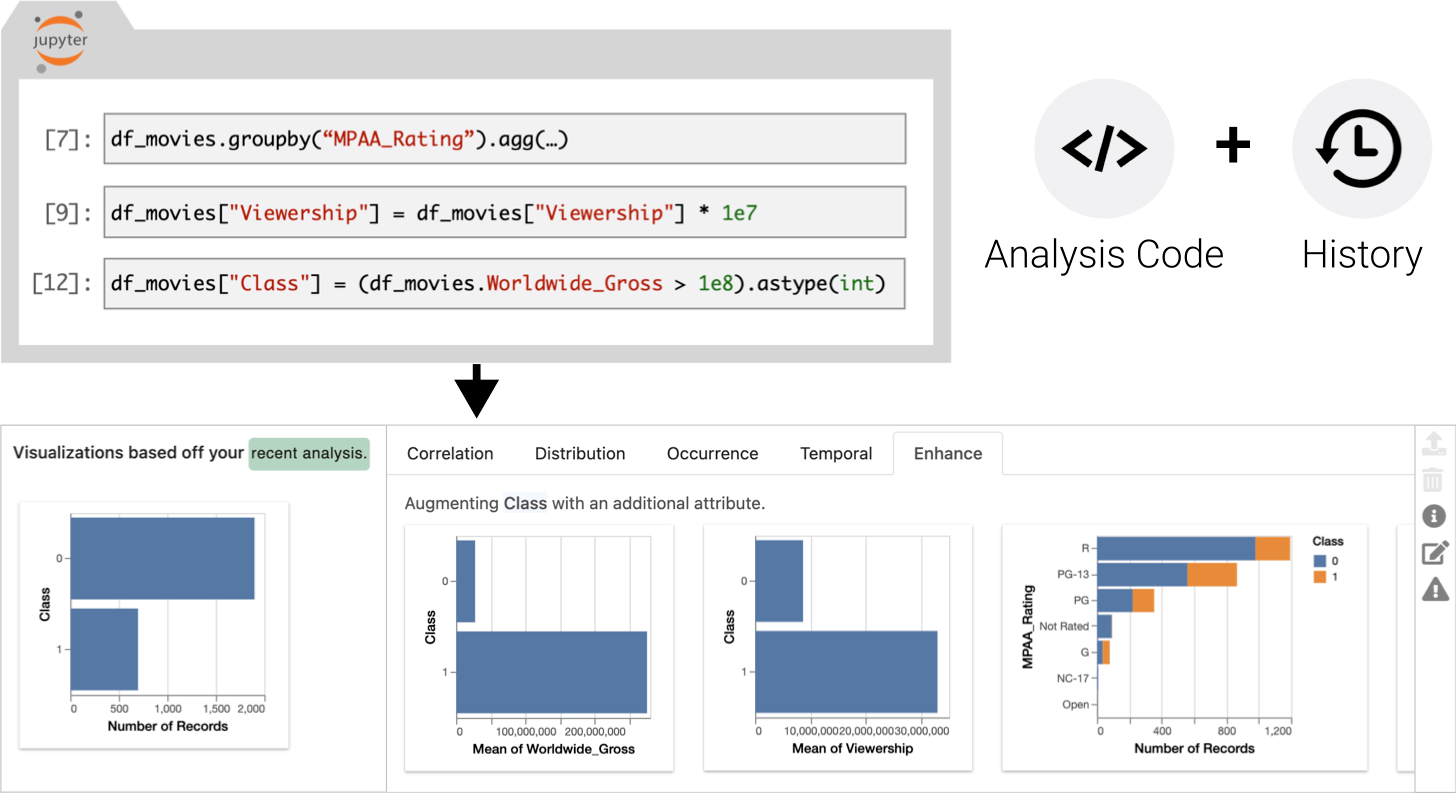
Leveraging Analysis History for Improved In Situ Visualization Recommendation
EuroVis 2022
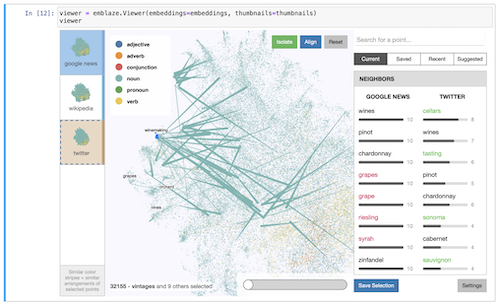
Emblaze: Illuminating Machine Learning Representations through Interactive Comparison of Embedding Spaces
IUI 2022
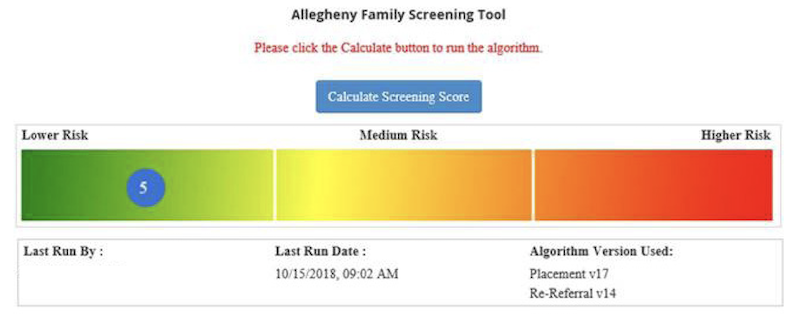
Improving Human-AI Partnerships in Child Welfare: Understanding Worker Practices, Challenges, and Desires for Algorithmic Decision Support
CHI 2022
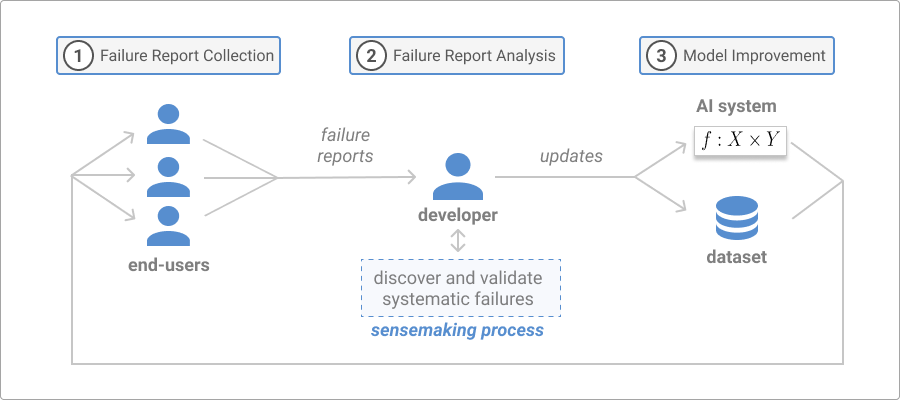
Discovering and Validating AI Errors With Crowdsourced Failure Reports
CSCW 2021
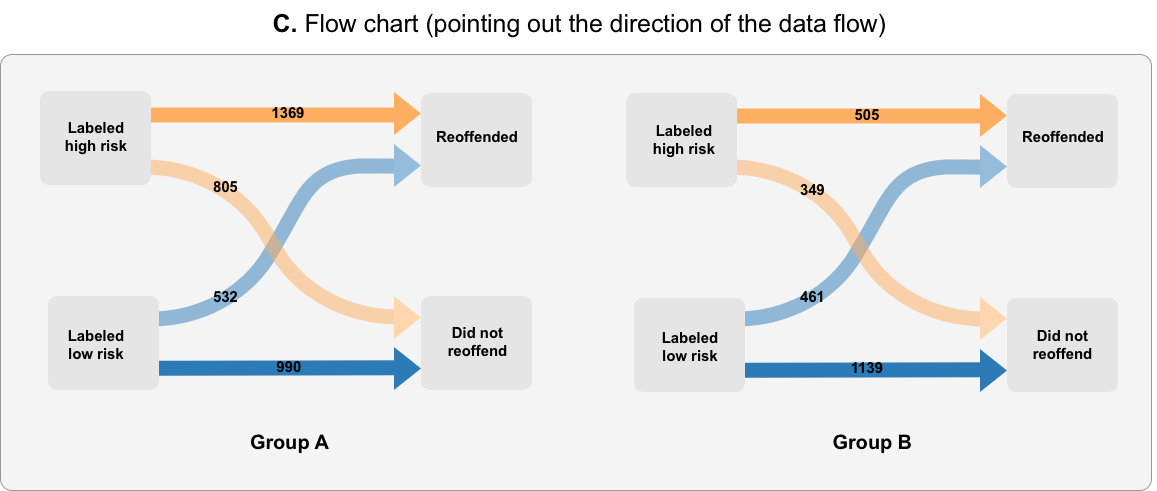
Designing Alternative Representations of Confusion Matrices to Support Non-Expert Public Understanding of Algorithm Performance
CSCW 2020
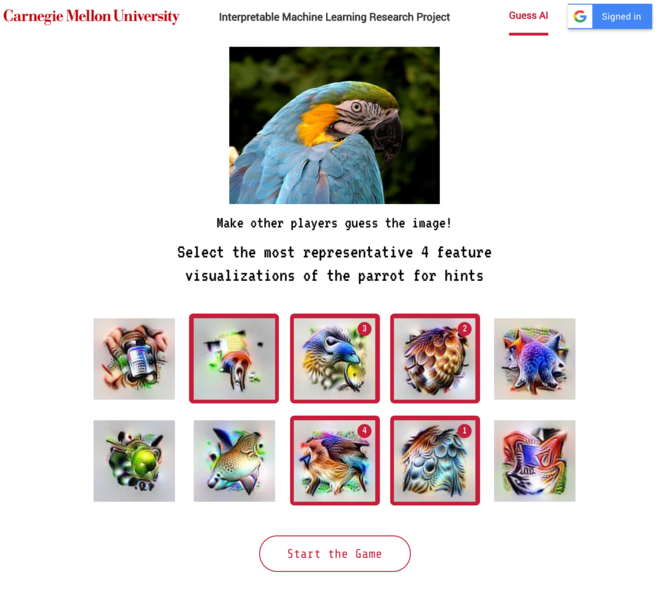
Getting Playful with Explainable AI: Games with a Purpose to Improve Human Understanding of AI
CHI 2020
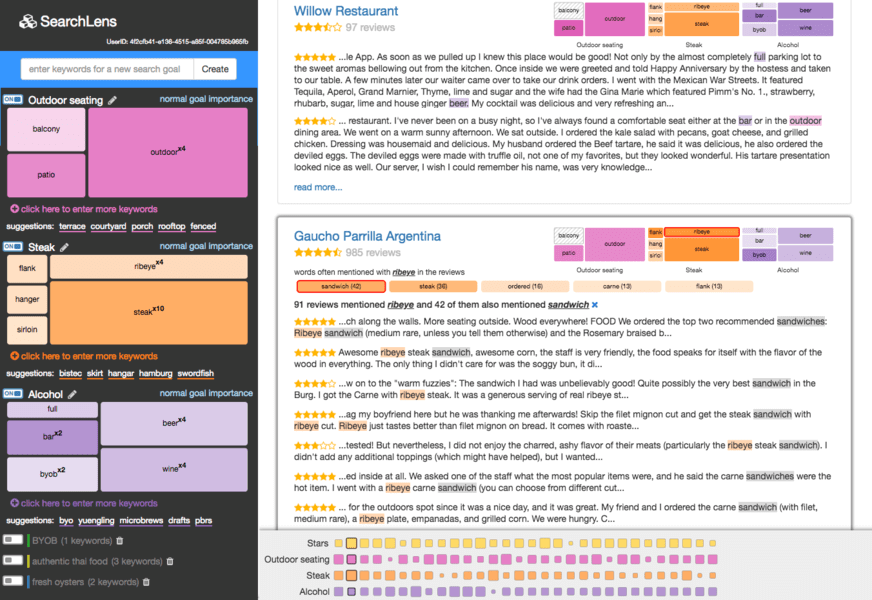
SearchLens: Composing and Capturing Complex User Interests for Exploratory Search
IUI 2019
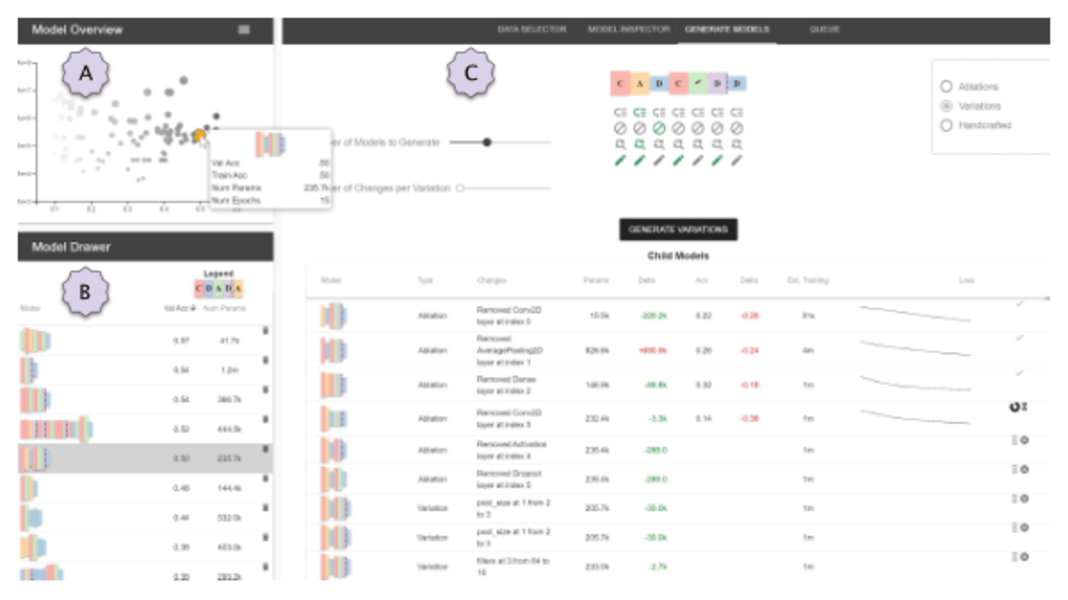
Ablate, Variate, and Contemplate: Visual Analytics for Discovering Neural Architectures
VAST 2019
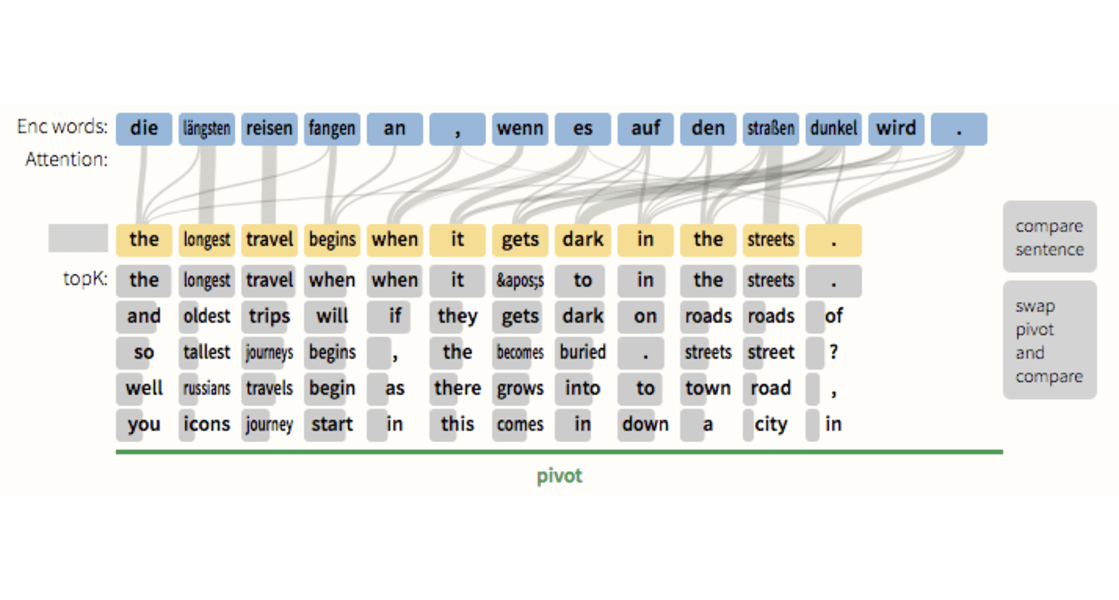
Seq2Seq-VIS : A Visual Debugging Tool for Sequence-to-Sequence Models
VAST 2018
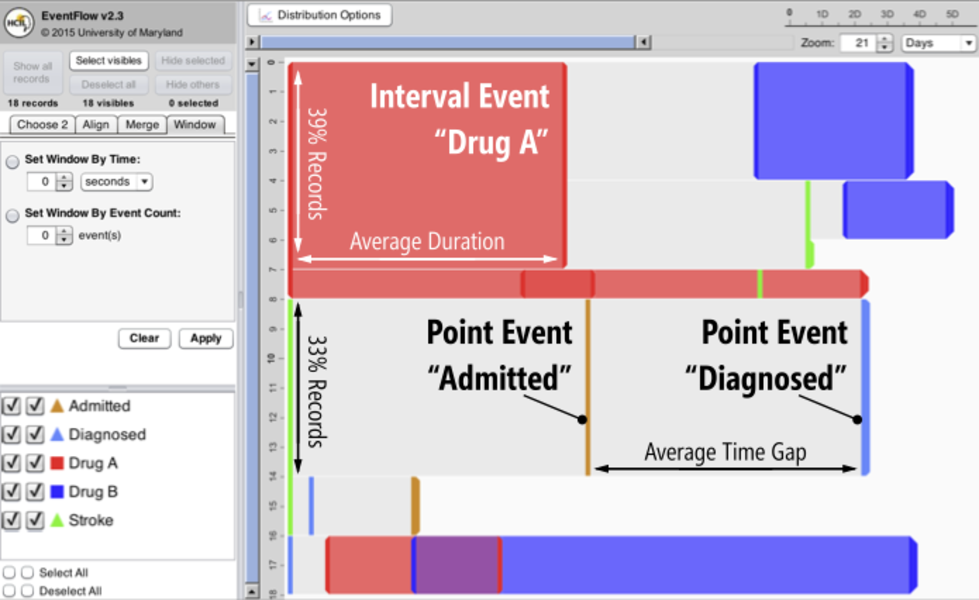
Coping with Volume and Variety in Temporal Event Sequences: Strategies for Sharpening Analytic Focus
IEEE Transactions on Visualization and Computer Graphics 2017
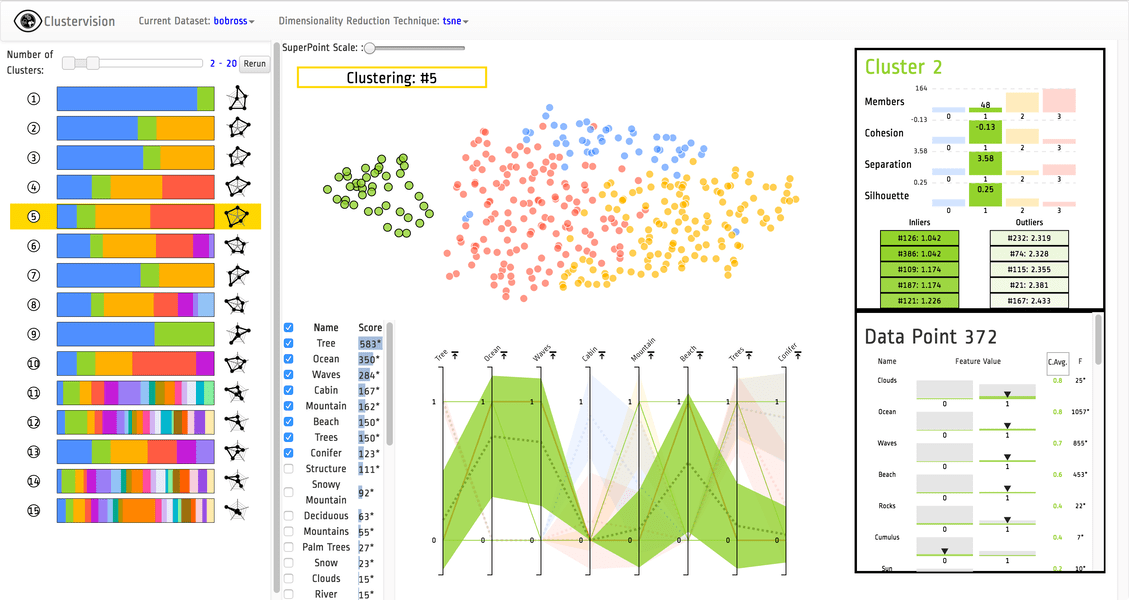
Clustervision: Visual Supervision of Unsupervised Clustering
VAST 2017
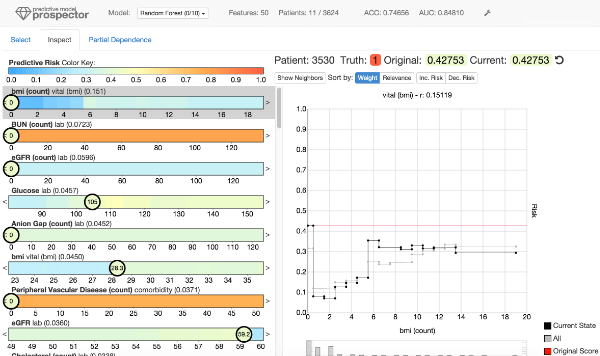
Interacting with Predictions: Visual Inspection of Black-box Machine Learning Models
CHI 2016
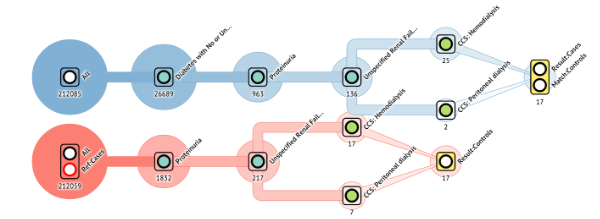
Supporting Iterative Cohort Construction with Visual Temporal Queries
VAST 2015
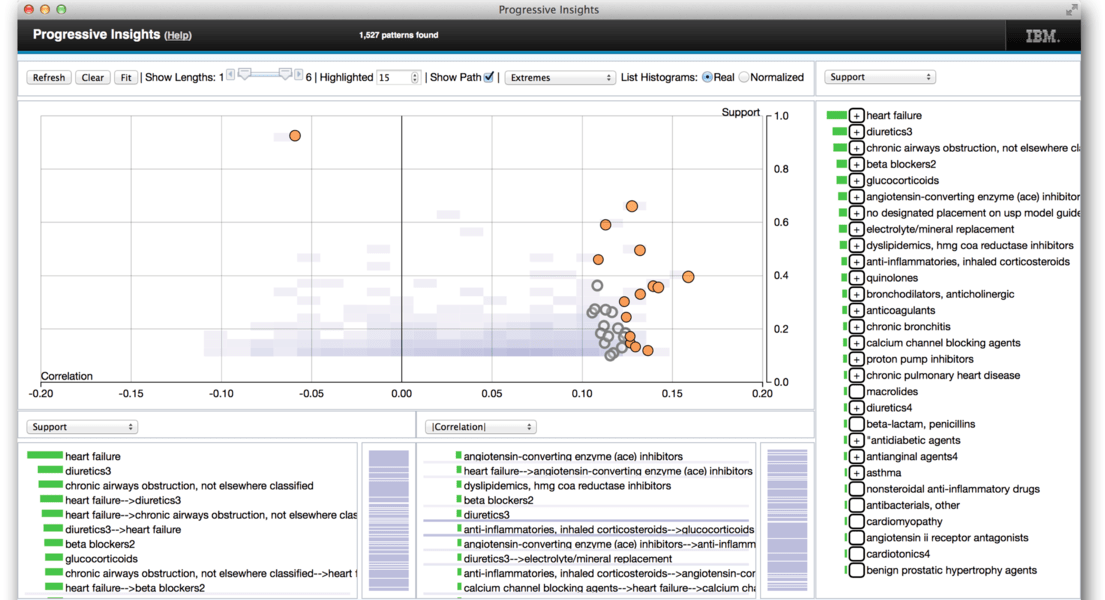
Progressive Visual Analytics: User-Driven Visual Exploration of In-Progress Analytics
VAST 2014
INFUSE: Interactive Feature Selection for Predictive Modeling of High Dimensional Data
VAST 2014
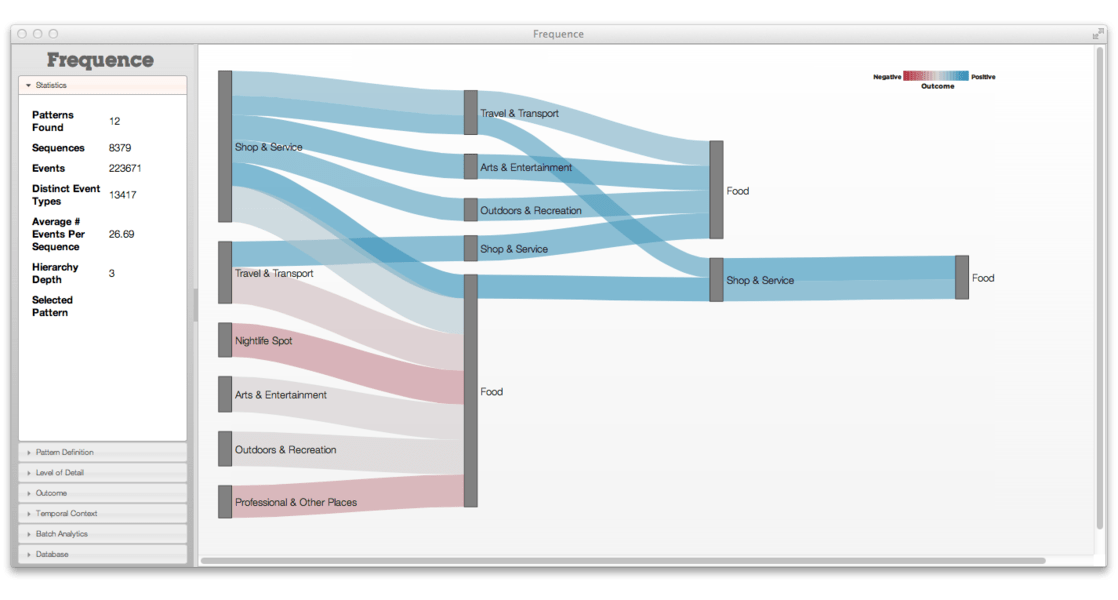
Frequence: Interactive Mining and Visualization of Temporal Frequent Event Sequences
IUI 2014
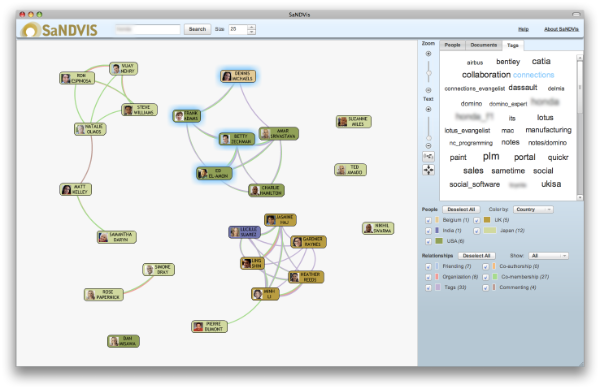
The Longitudinal Use of SaNDVis: Visual Social Network Analytics in the Enterprise
IEEE Transactions on Visualization and Computer Graphics 2013
Data-Driven Exploration of Care Plans for Patients
CHI 2013
Orion: A System for Modeling, Transformation and Visualization of Multi-dimensional Heterogeneous Networks
VAST 2011
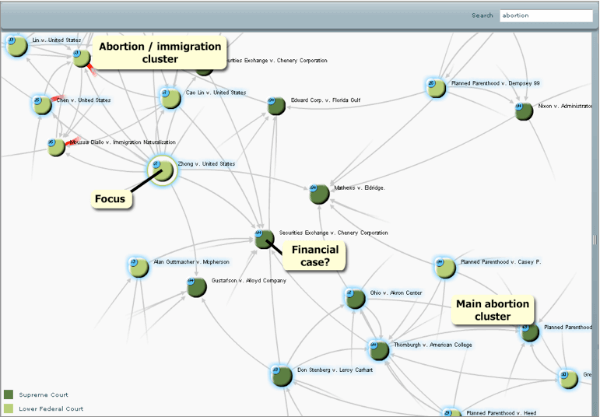
Search, Show Context, Expand on Demand: Supporting Large Graph Exploration with Degree-of-Interest
IEEE InfoVis 2009
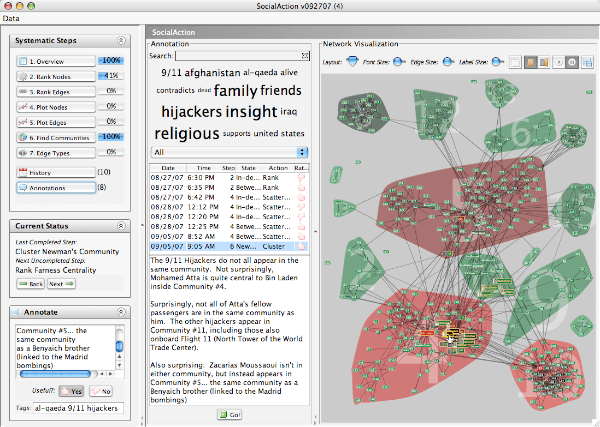
Systematic Yet Flexible Discovery: Guiding Domain Experts Through Exploratory Data Analysis
International Conference on Intelligent User Interfaces 2008
Integrating Statistics and Visualization: Case Studies of Gaining Clarity During Exploratory Data Analysis
ACM Conference on Human Factors in Computing Systems 2008
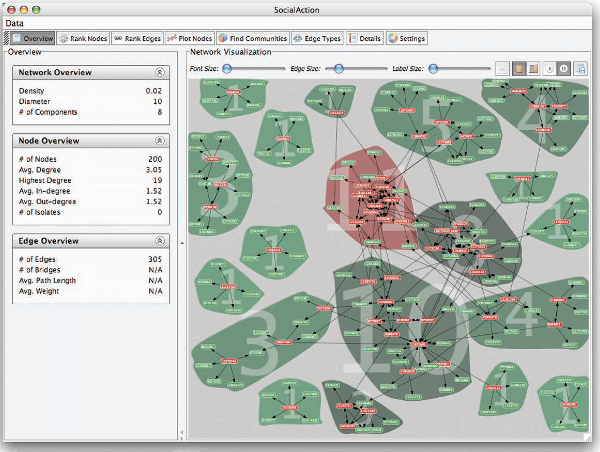
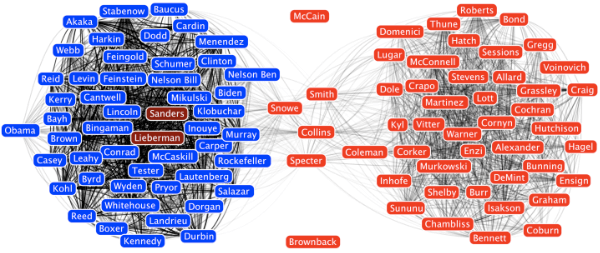
Balancing Systematic and Flexible Exploration of Social Networks
IEEE InfoVis 2006
Teaching
- Data Visualization Fall 2024
- Data Science for Product Managers Spring 2023
- HCI for Product Managers Spring 2023
- Interactive Data Science Spring 2022
- Data Visualization Fall 2021
- Interactive Data Science Spring 2021
- Interactive Data Science Fall 2020
- Data Science and Visualization Spring 2019
- Interpretable Machine Learning Spring 2019
Advising
-
PhD Students
- Arpit Mathur
- Katelyn Morrison
- Venkat Sivaraman
- Will Epperson
- Aidan Bradshaw
- Eli Slothower
- Unn Seo (Grace) Park
- Ziyong Ma
Masters Students
Undergraduate Students